Politics. We hate to talk about it. Even the best of friends or spouses can disagree vehemently over political ideology; especially during this campaign season, which seems to have taken divisive rhetoric to a new level. However, not addressing the 800 pound gorilla in the room can be just as bad for your finances as debates can be for your relationships. So, how can we objectively look at the election and develop a strategy to navigate our investments through such an emotional time? It's difficult, but we've seen elected officials change over before, and we can draw some key conclusions from the data.
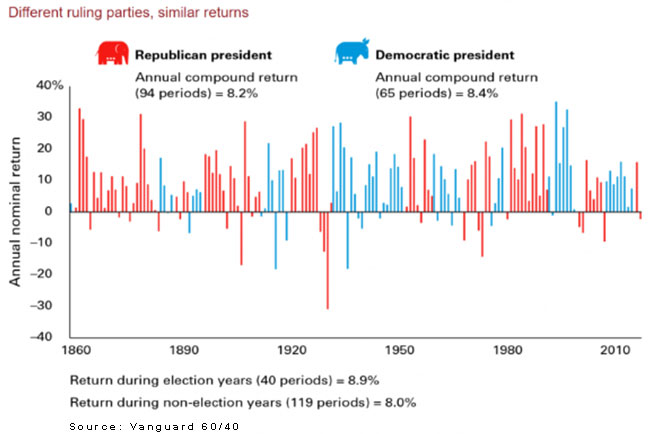
One of the most common questions we get is whether investments do better under Republican or Democrat administrations. The answer is of course, both :-) You can find statistics that support whatever conclusion you want to find, but according to a study done by Vanguard, since 1860 a balanced 60/40 portfolio of stocks and bonds has averaged 8.2% under Republican presidents and 8.4% under Democratic presidents.
What about some other measurements? Did you know that the stock market performs much better under left-handed Presidents to the tune of a 17.4% return, while on the other hand, righties only averaged 11.6%? Or, how about differences in height? Presidents over 6 feet tall have overseen returns on average of 15.65% versus only a 7.23% for the vertically challenged officeholder.
Many studies we have reviewed use arbitrary start dates to fit their bias and crop out a particular bad subset of data for the party of choice. For instance, from 1926-2019 we had a Democratic President for 48 years and a Republican President for 46 years. On average, the Democratic Presidents have seen an annualized stock market return of 14.94% versus 9.12% for Republican Presidents — that's a substantial annualized difference of 5.82%. But, is it fair to pick a start date with a Republican, Herbert Hoover, in the White House at the precipice of the market right before the onset of the Great Depression which led to -30% average returns during his presidency? Does the next President, FDR, a Democrat, get all the credit for the 33%+ average market returns in his first four years, when he started at such a low point? In more modern history, the stock market performed the best under a Republican, Gerald Ford, averaging an 18.6% per year return during his tenure. The next best, was a Democrat, Bill Clinton, who oversaw average annual gains of 14.9%. But, do they really deserve credit for the boom under their watch, or were there extenuating circumstances? Ford entered office at the trough of a recession handed to him by Richard Nixon, and Clinton was lucky enough to be in power as the run-up of the Nasdaq Tech Bubble was hitting an extreme that would soon pop under the Republican Bush administration.
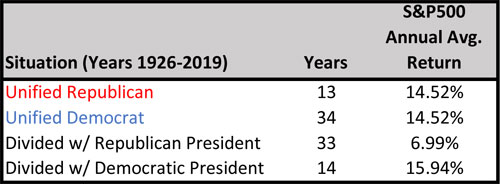
What about the argument that a president may have been held back or helped by members of the opposing party in Congress? Is gridlock good for investments? From 1926-2019, we have had an equal number of years of unified government (where the same party controls the presidency and both houses of Congress) and divided government (where at least one house of Congress is different from the president's party). During periods of divided government, the S&P 500 averaged 9.66% per year, but during periods of unified government, the average returns jumped to an average annualized return of 14.52%. Breaking the numbers down further, you can see that both Republicans and Democrats had almost identical performance when government was unified, but markets performed much better relatively speaking with a Democrat at the helm in a divided government. There is only 14 years of data for that scenario, and that hardly shows cause and effect to draw any real conclusions. It does at least lend credibility to the notion that, contrary to popular theory, the market does not like gridlock.
When we consider that a presidential term is 4 or 8 years, and the average business cycle is 5.5 years, it is completely normal to expect that we will see the two work together in some instances and not in others. Case in point, in the last 11 years we have not seen a normal business cycle. Since the trough of the Financial Crisis in 2009, we have had a longer than usual economic expansion that lasted until the beginning of the Coronavirus pandemic. This boom was most likely sustained by the Federal Reserve's easy monetary policy, and both Presidents Obama and Trump, one Democrat and one Republican, were the beneficiaries of above-average market returns. During their presidencies, we saw both unified government, where both parties controlled two branches of government under Obama, and divided government, where the opposite party held the other one in check. In both instances, the stock market prospered. As famed Wharton business school professor Jeremy Seigel noted, "Bull & Bear markets come and go, and it's more to do with business cycles than Presidents."
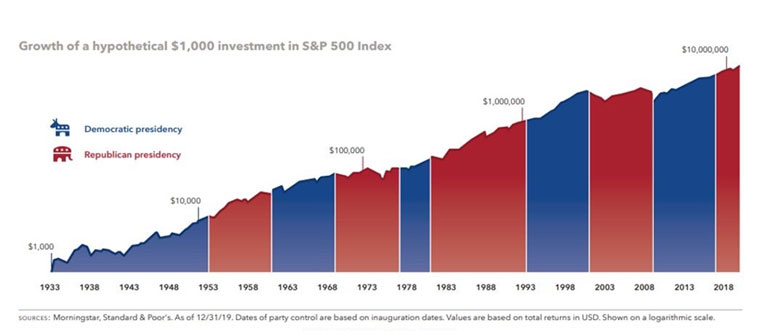
Accordingly, we believe that there is no conclusive evidence that the political party in control of either the Presidency or Congress has a statistically significant impact on stock market returns. The stock market is a very complex animal, and its direction is determined by a number of factors including the business cycle, valuations, corporate profits, monetary policy, and exogenous shocks like natural disasters or the coronavirus. Certainly, the fiscal policies of Congress and the domestic and foreign policy agenda of the White House are pieces of the puzzle, but don't let your personal preference in the upcoming election inform your investment policy statement. Since 1933, a $1,000 investment in the S&P 500 would have grown to almost $10 million! That works out to roughly 10% annualized returns that compounded over time. That $1,000 has grown exponentially regardless of which party controls the White House.
Also, be careful not to read too much into the tea leaves and talk on the campaign trail. Most candidates preach an aggressive agenda for their term in office, only to realize that many of the promises can't come to fruition. The ideas you may view as extreme end up becoming more moderate in reality as presidents are forced to compromise and much of the legislation gets watered down in Congress. It can also be a trap to assume that one party and their platform may hurt certain sectors of the economy. Under President Obama, it was widely assumed that the Affordable Care Act (ACA) would severely hurt the healthcare sector, and stocks initially sold off as a result. However, since the ACA became law, the S&P Healthcare index of 63 stocks in that sector have greatly out-performed the S&P 500. Likewise, it was assumed that a victory for President Trump in 2016 would be a boon for the financial, energy, and defense stocks. However, all three of those sectors have been some of the worst relative performers during his tenure. All of this is to say, don't let your portfolio get sidetracked by the political battle royale. Diversification and balance are still the keys to long-term investment returns.